
Attended the Observe, Collect, Draw Workshop
After being a student in the Observe, Collect, Draw Workshop I have a new appreciation for analog data. Two instructors ran the workshop: Giorgia Lupi and Stefani Posavec, both are experts in working with data, visualizing, and finding deeper insights through the process of gathering and visualizing data. They also created the fascinating Dear Data project where they would capture personal observations, process the data, and visualize it on a postcard for one another every week for a year.

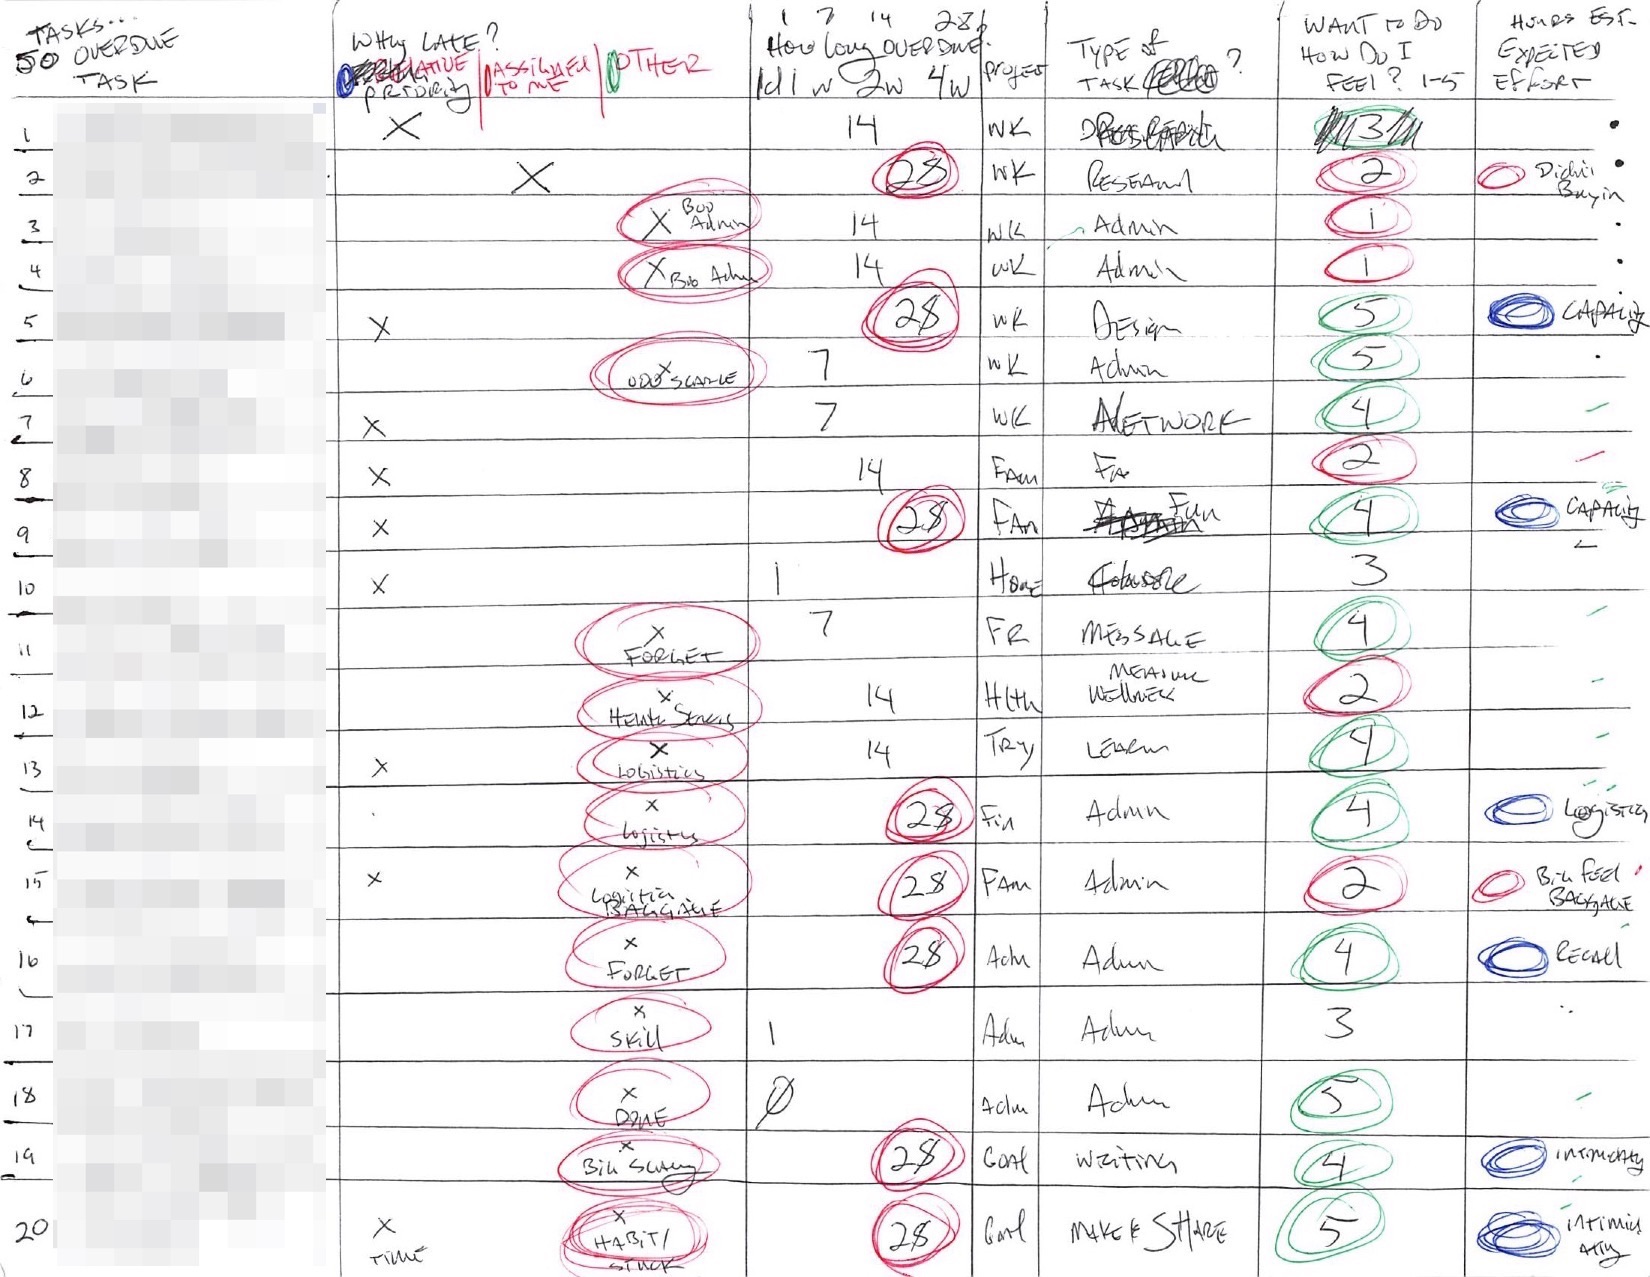
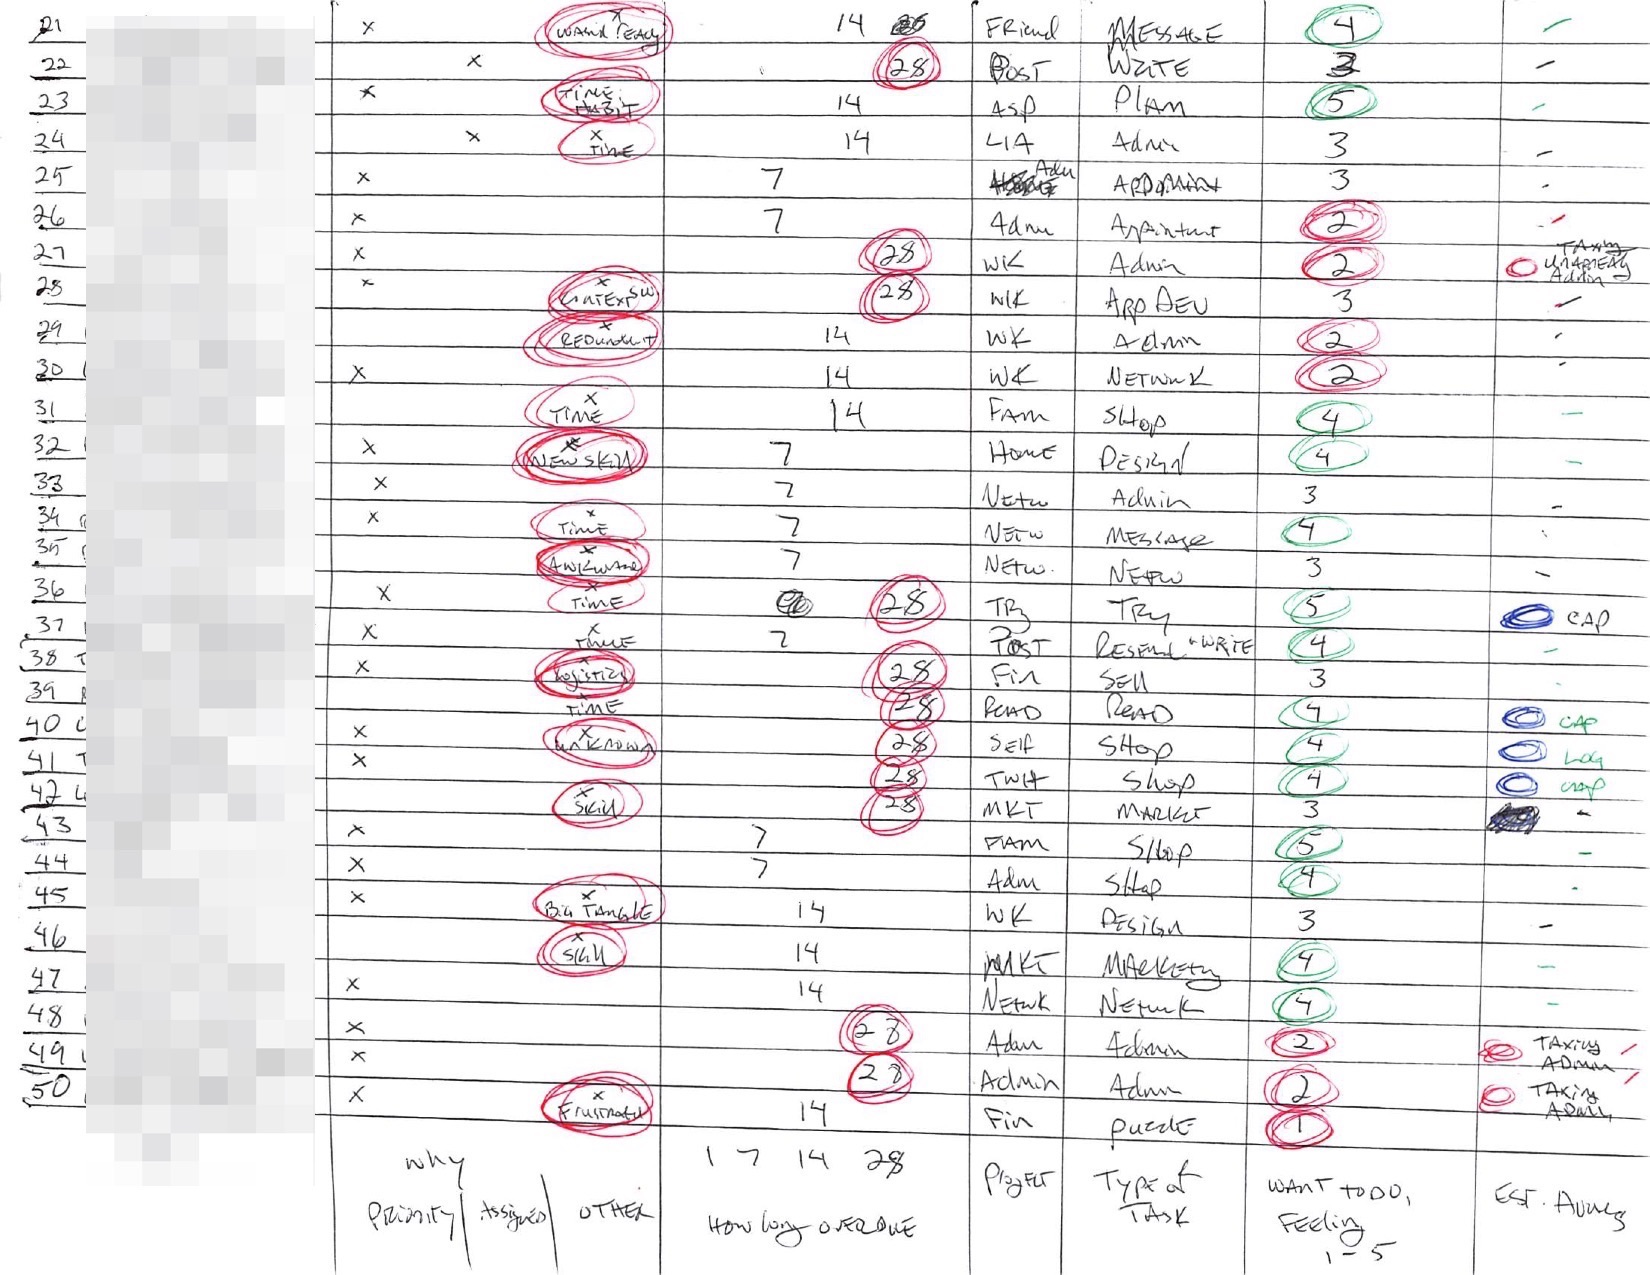
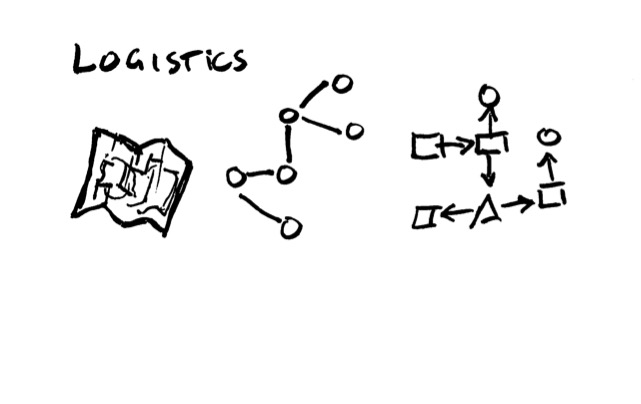
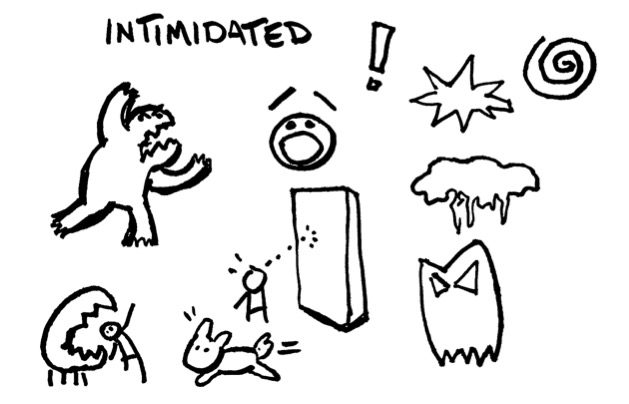
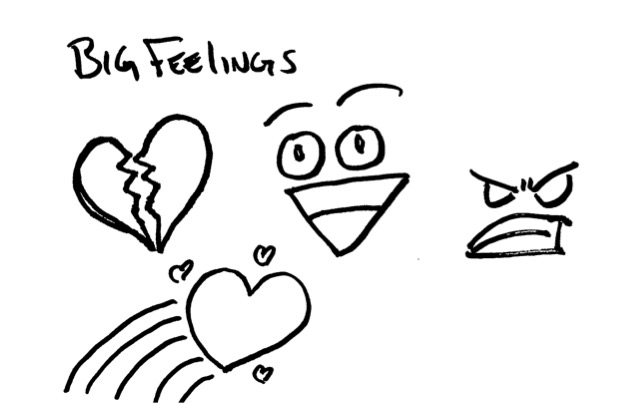
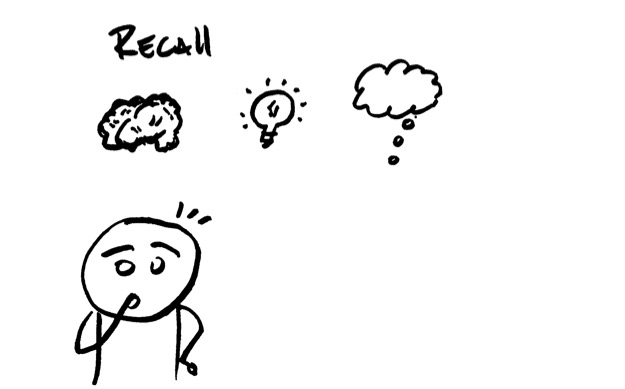
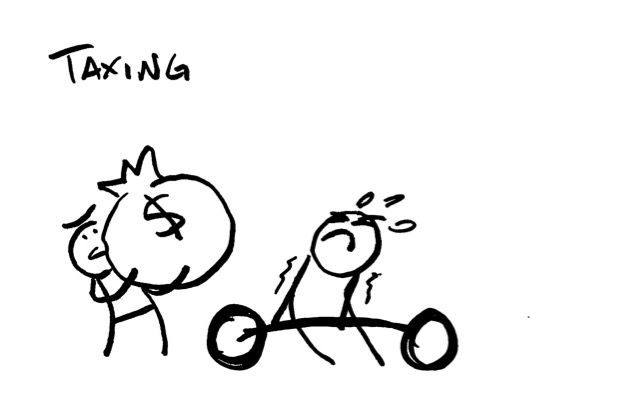
My doodle notes overview, captured throughout the workshop day
The workshop had sections of lecture, covering inspiration, theory, and process for gathering and visualizing data mixed with sections of hands-on exercises to experience the data gathering and visualizing first-hand.
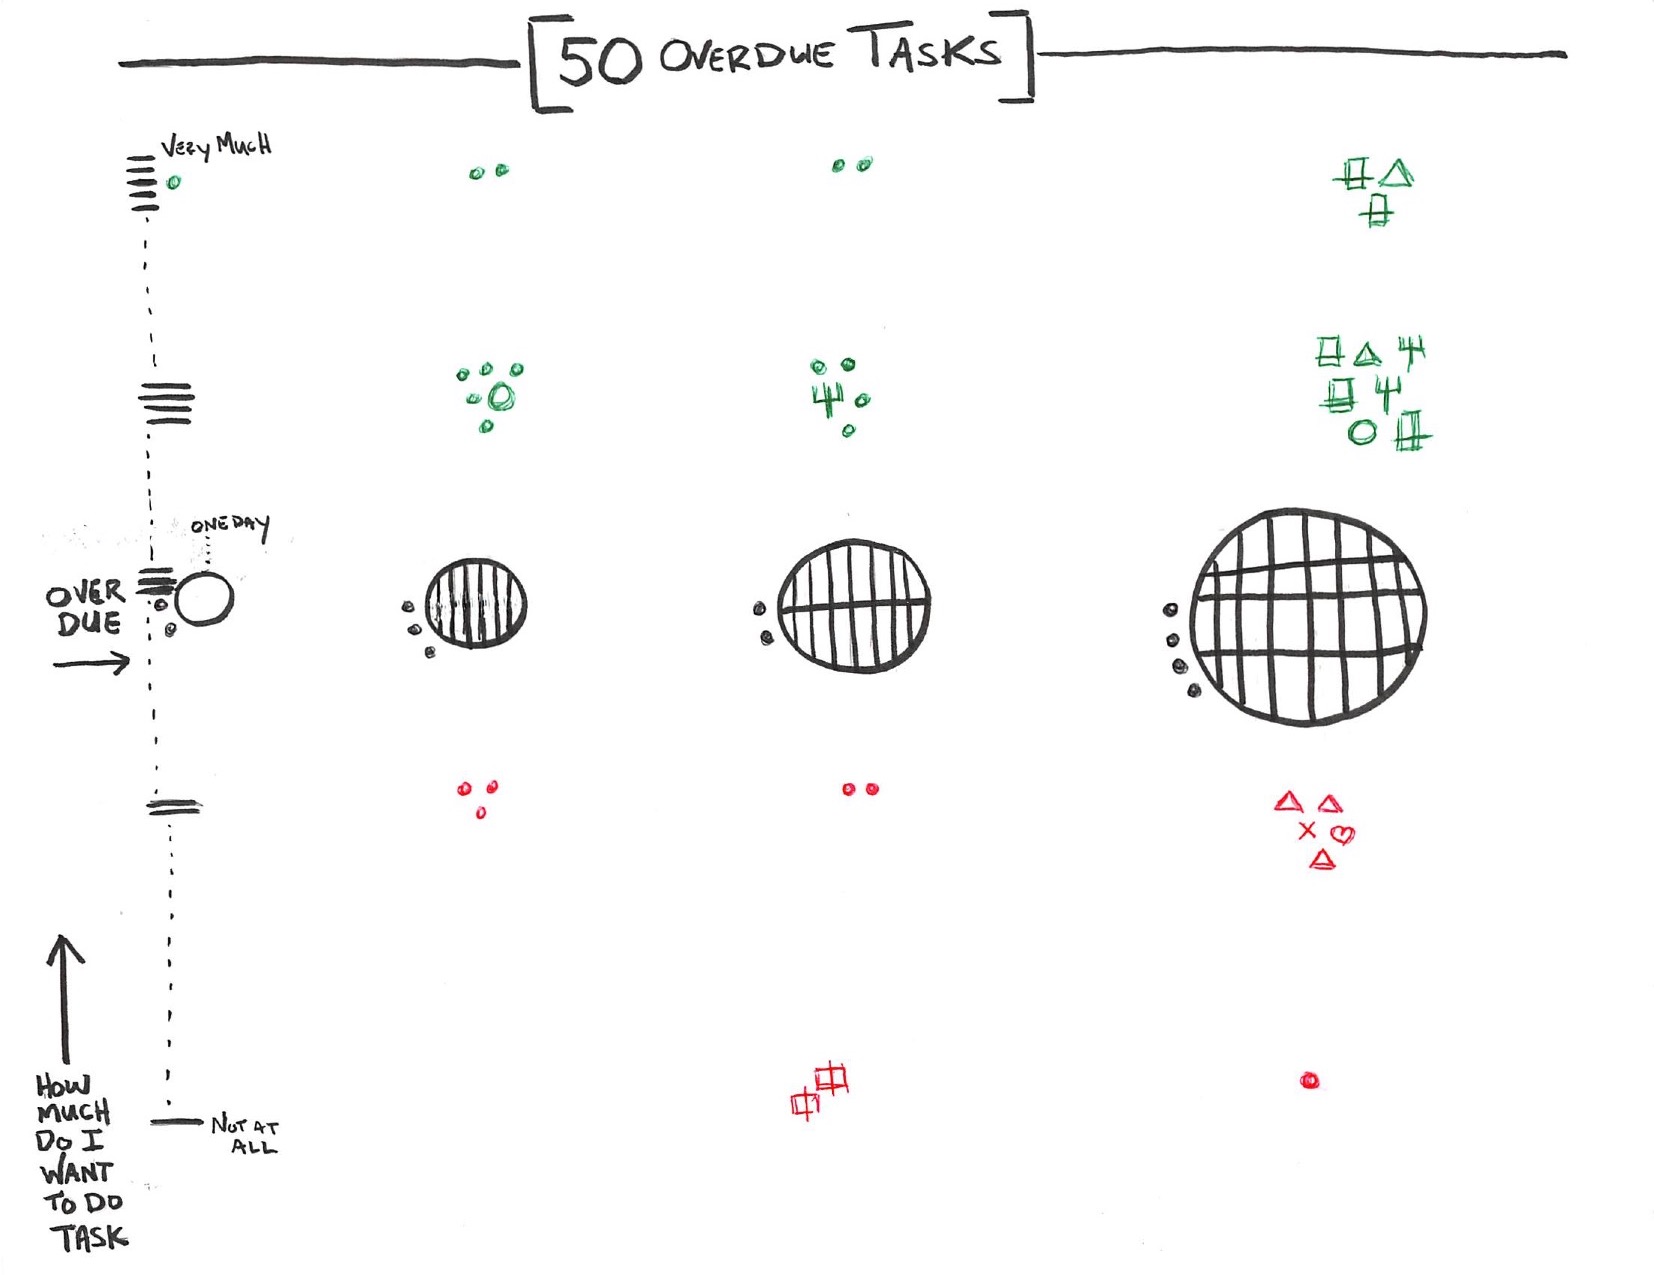
Choosing some personally relevant data was the first challenge. The instructors suggested using your text/sms history with someone, your music listening habits, or photo taking habits as options to consider digging into. I chose to learn from my 50 overdue tasks in Omnifocus.

From there, we all gathered data and observations about the data. This analog approach is different than how I've worked with data in the past. For example a while back I did an experience inventory project where I gathered 240 experiences from the year past and gave them about 20 attributes of rating and categorizing. It was a digital process of data, scripts, and reports. This new project was all pen and paper which felt different in a more focused on the topic sort of way.
Once I had all the data, the key insights I started to notice were I had a potential cluster of tasks based how overdue and based on how much or little I wish to do that given task.
Then we moved into the data visualization part. How to convey the insights and possibly discover more about the data and insights while exporing ways to visulize it all.
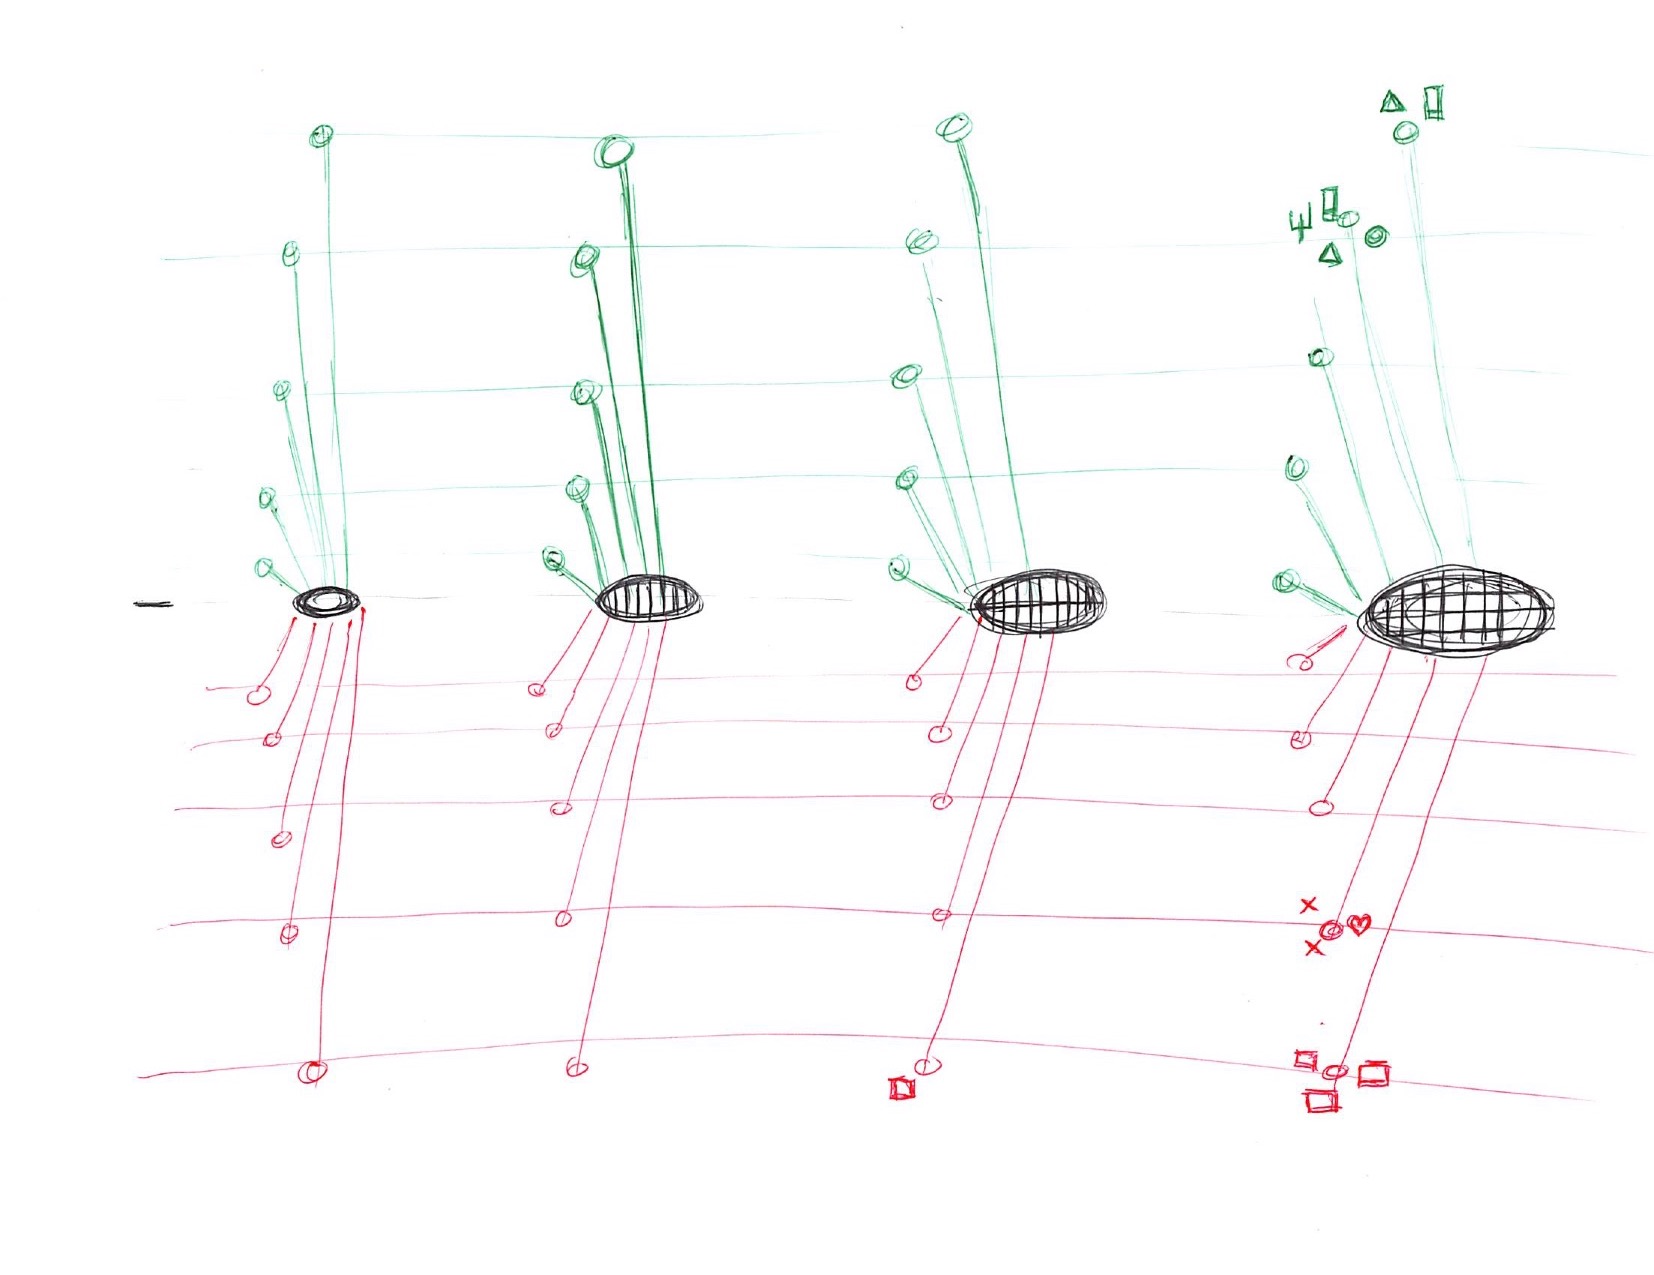
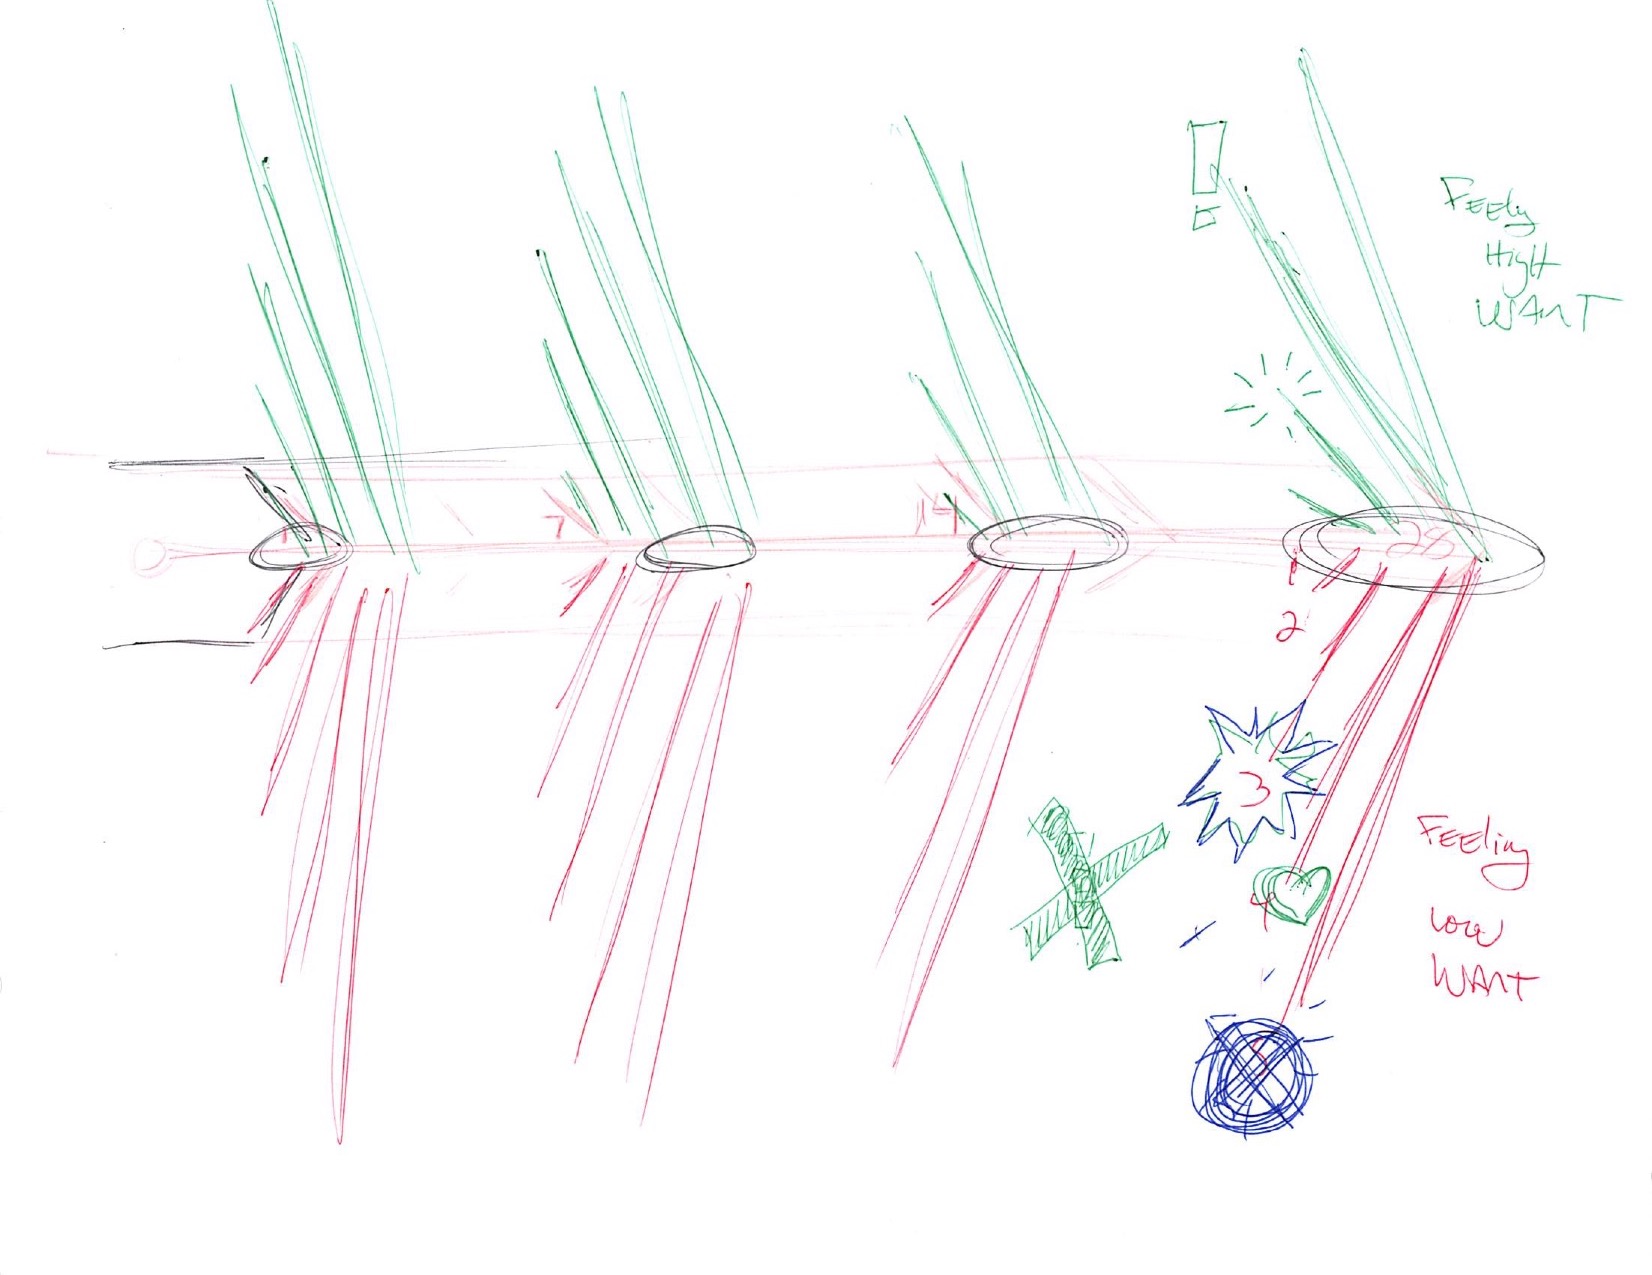
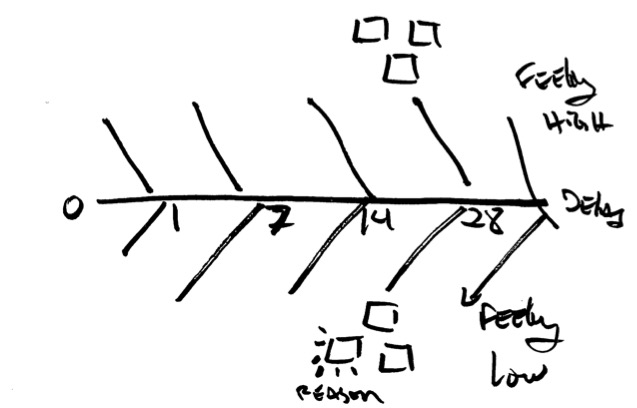
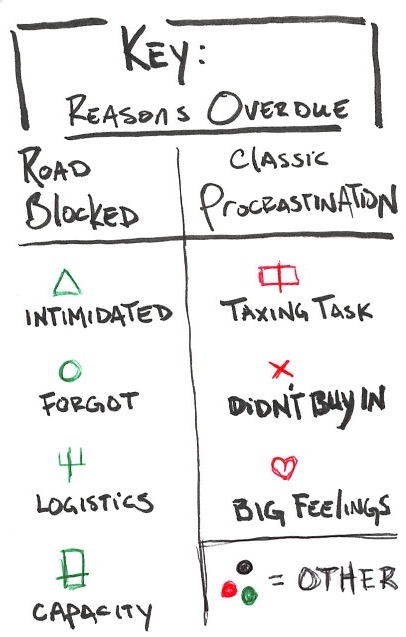
After a process of refining, here's the direction I landed on. Two axis of the drawing, one had the amount of days delayed 1, 7, 14, or 28... the other is the rating of how much or little I wanted to engage with the task. Layered on top of this is the nuance of clarifying why I didn't engage or what might be blocking me from engaging with the task.
I thoroughly enjoyed this workshop and I'm glad to hear the instructors have a book coming out this September.